With the success of my earlier series on global equal area map projections (starting with this overview), I received a number of requests to produce a similar how-to article for polar maps. The first part of this article (published here) provides an overview of a number of different map projections commonly used for polar maps. Next week, I shall provide a guide to producing a working map of the northern hemisphere centered on the North Pole, using the Stereographic Projection.
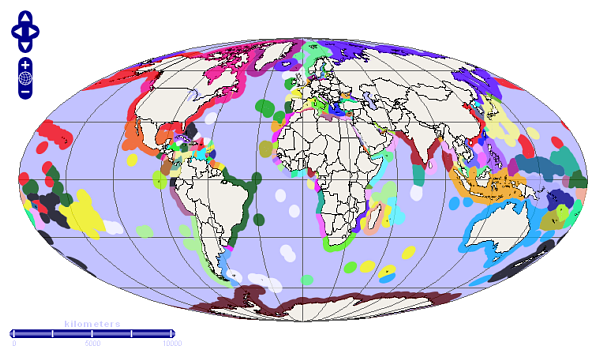
Global maps commonly use cylindrical or pseudo-cylindrical projections aligned with the equator. Such equatorially-aligned projections have extreme distortion near the polar regions. Projections such as the Mercator retain local shape at the expense of extreme stretching. Other projections distort shape, for example the Mollweide projection:
The solution is to use a polar-oriented projection instead.
Cylindrical, Pseudo-Cylindrical, and Conic Projections
One approach is to take a cylindrical or pseudo-cylindrical projection and use a polar or oblique aspect. One of the most common projections like this is Lambert’s Transverse Mercator Projection:
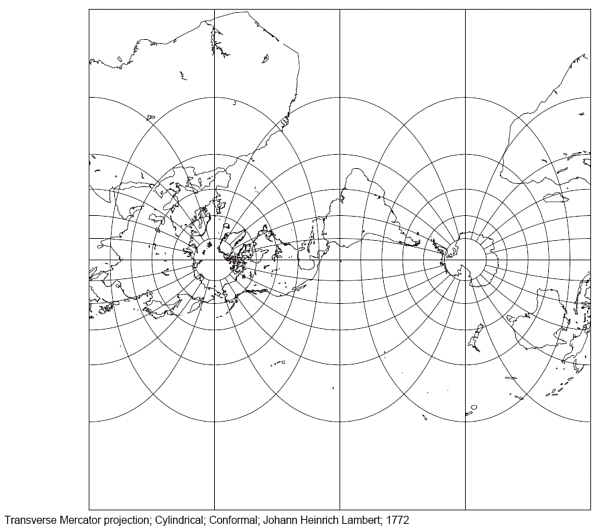
The above projection produces a good representation of both polar regions, and a belt connecting them. A common alignment is to use this projection to map North and South America which are nicely covered by the projection with limited shape distortion. The Universal Transverse Mercator (UTM) system is based on numerous Transverse Mercator projections, but does not extend them to the polar regions.
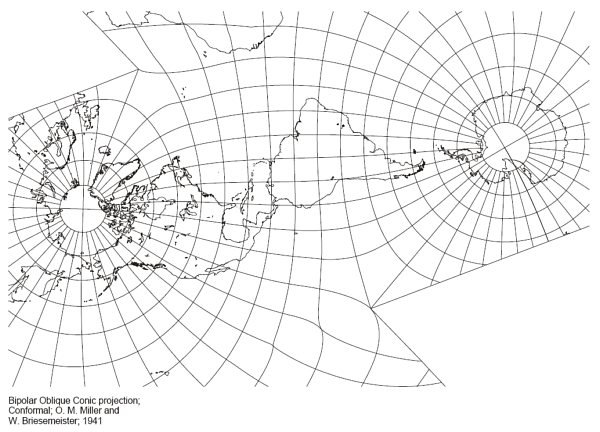
A similar approach can be used with conic projections. This is demonstrated by Miller & Briesemeister’s Bipolar Oblique Conic Projection:
Azimuthal Projections
Azimuthal projections are usually used for regional maps that are intended to cover one of the polar regions. These project the Earth’s surface to a plane. The plane often forms a tangent with the Earth’s surface, and this tangent point is typically the central pole of a polar map. All azimuthal projections have the property that direction is preserved from this central point. This, combined with the radial nature of azimuthal projections, mean a polar-centered azimuthal projection will represent lines of longitude by radial straight lines, and lines of latitude (‘parallels’) by concentric circles.
The remainder of this article consists of a survey of different azimuthal projections, and these will be implemented in the second part of this article. As with the equal area projections, a projection is only considered if it is deemed practical, ie. it is supported by both ESRI and the open source Proj.4 library.
Many azimuthal projections are only valid for the hemisphere surrounding the central point. The remainder are capable of projecting the opposing hemisphere, but only with extreme distortion. Therefore we will only consider and implement the near hemisphere.
Stereographic Projection
The Stereographic Projection projects from the antipodal point to the tangent plane that has a tangent point at the central point. Ie. a North Pole Stereographic Projection will project from the South Pole.
The projection is conformal (ie. local shapes are accurate) but scale and area are both distorted. Local angles are also accurate.
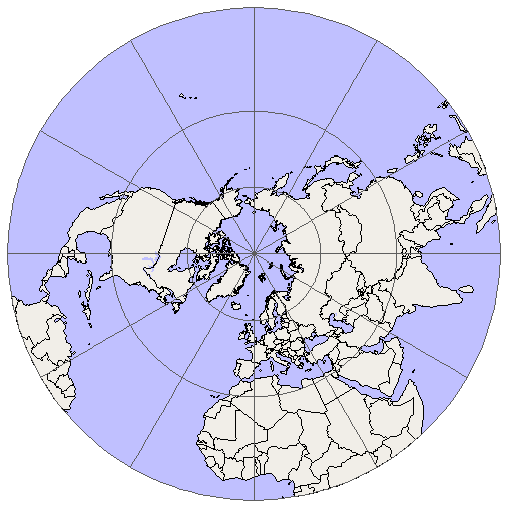
The Stereographic Projection is considered an ‘ancient’ projection, and was first used for polar star maps by Hipparchus, Ptolemy, and probably earlier Egyptians.
It is a popular choice for terrestrial polar maps, and has also been used in an oblique aspect for planetary maps. Due to the local angle property, this projection is also used extensively in crystallography to plot crystal faces, and important directions in the crystal lattice.
Implementation Notes: The Proj.4 library implements two variants of the Stereographic Projection: stere and sterea. stere uses simpler formulae, but sterea has less distortion near the center. sterea is also discontinuous along the antipode of the central meridian – ie. it should only be used for the near hemisphere.
Universal Polar Stereographic (UPS)
This is a special version of the Stereographic Projection, intended to be used as a polar accompliment to the Universal Transverse Mercator (UTM) system.
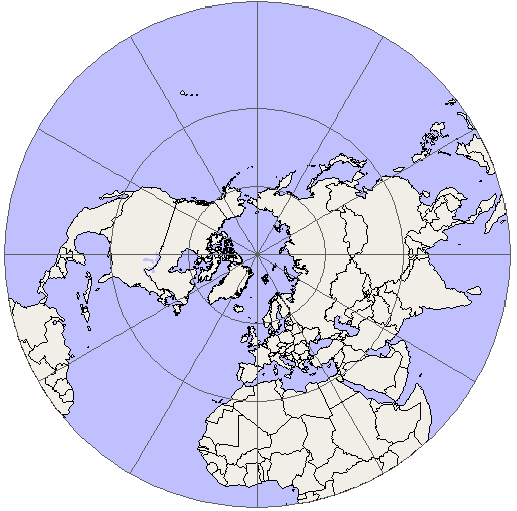
The UPS projection is intended to be used north of 84°N or south of 80°S. The projection is defined so that true scale occurs at latitude 81°6’52.3″ north and south. Scale is reduced towards the pole.
Gnomonic Projection
Also known as: Horologium, Horoscope
Moving the projection point to the Earth’s center results in the Gnomonic Projection. The Gnomonic Projection is not conformal and it does not preserve areas. Shape distortion is considered to be “moderate” within 30 degrees of the center. Note that the Equator is projected to infinity.
These disadvantages are balanced by the useful property that all great circles become straight lines, regardless of aspect. Ie. even oblique great circles will appear as straight lines on the Gnomonic Projection. This property is useful for navigation, and can be usefully applied to non-polar aspects.
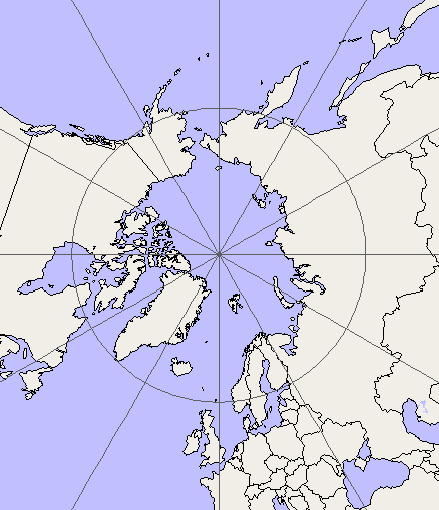
This is another azimuthal projection that is considered to be ancient. It has applications in the design of sun dials, and it was first used in this manner by Thales of Miletus (ca. 624-547 BC). The historical names of Horologium and Horoscope refer to this sun dial application, as does the modern name (a sun dial has a gnomon). The modern name of ‘gnomonic’ was first used by Deorgan in 1836, although the similar ‘Gnomic’ was in use by 1749.
Orthographic Projection
The Orthographic Projection is a parallel projection onto the tangent projection plane. This is equivalent to a perspective projection viewed from infinity (ie. similar to a real world view from a different star system). This is very similar to the Near-Sided Perspective Projection (see below) but with a height of infinity.
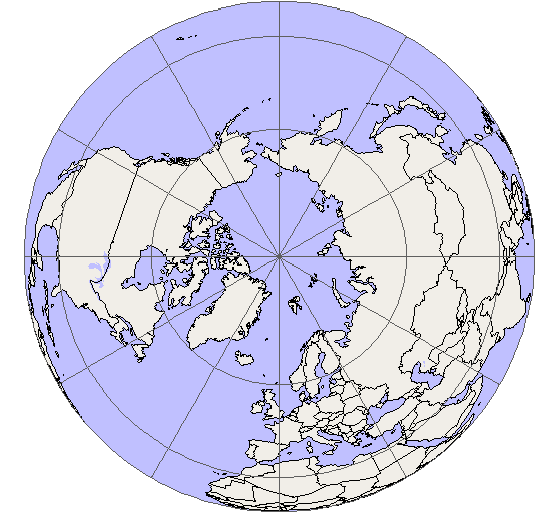
The Orthographic Projection is not conformal. Distortion is minimal at the center, but increases to a maximum at the edges as the area and distance scales decrease to zero.
This is another ancient projection. Hipparchus used it in the 2nd century BC to determine places of star-rise and star-set. The Roman architect, Marcus Vitruvius Pollio used it in about 14BC to construct sun dials and compute sun positions.
Near-Sided Perspective Projection
Also known as: Perspective, Vertical Near-Side Perspective, Vertical Perspective, General Perspective
The Near-Sided Perspective Projection is a perspective projection. Ie. it gives a real-world view at height h above the Earth’s surface. The illustration below was created with h=7000km.
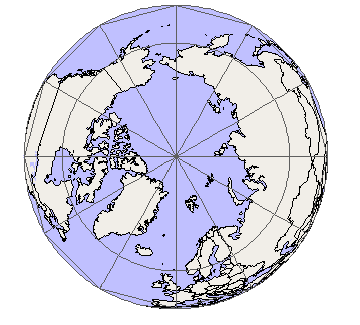
The Near-Sided Perspective Projection is widely used in a number of online mapping applications that attempt to show the Earth from space, such as Google Earth and NASA World Wind.
(In the above image, the dodecagonal graticule line near the equator is a side effect of the plotting process used)
Lambert Azimuthal Equal Area Projection
Also known as: Lorgna, Zenithal Equal Area, Zenithal Equivalent, Schmidt Equal Area
This is the only equal area projection considered here. Distance and shape distortion increase from the center, but shape distortion is restricted to only 2% within 15 degrees of the center.
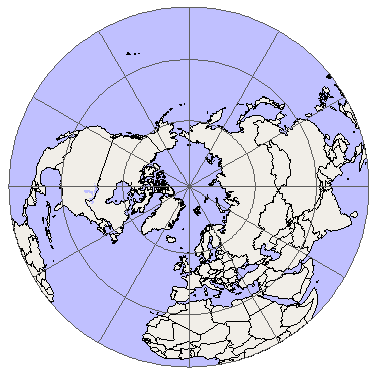
The equal area property makes this projection useful for traditional equal area applications such as geostatistics and population density. Other aspects can be used to display large areas such as entire continents.
This projection is also used in structural geology to plot geological orientations and to allow for the statistical analysis of dominant orientations. This information is often hand-plotted using a graticule known as a Schmidt Net. This is often referred to as a ‘Schmidt Equal Area Stereographic Projection‘ although it is not a true Stereographic Projection.
Azimuthal Equidistant Projection
Also known as: Postel, Zenithal Equidistant
This projection is neither conformal nor equal area, however distance and direction are accurate from the center. ESRI only recommend the use of this projection within 30 degrees of the center where distortion is limited to 4.7% along the parallels.

This is another ancient projection, and was used on many early star maps. The oldest surviving example is Conrad of Dyffenbach’s star map of 1426. During the 16th century, it was used by Giovanni Vespucci for maps of the southern hemisphere, and by Mercator for maps of the polar regions.
Summary
This completes my survey of polar projections. Next week I shall show you how to implement these projections in a web application that uses UMN MapServer and OpenLayers.
Acknowledgments
The black and white line drawings of various map projections are public domain images created by Paul B Anderson.
Implementation code for the above map images will be included in next week’s article.